01 · The result
Every threshold, passed
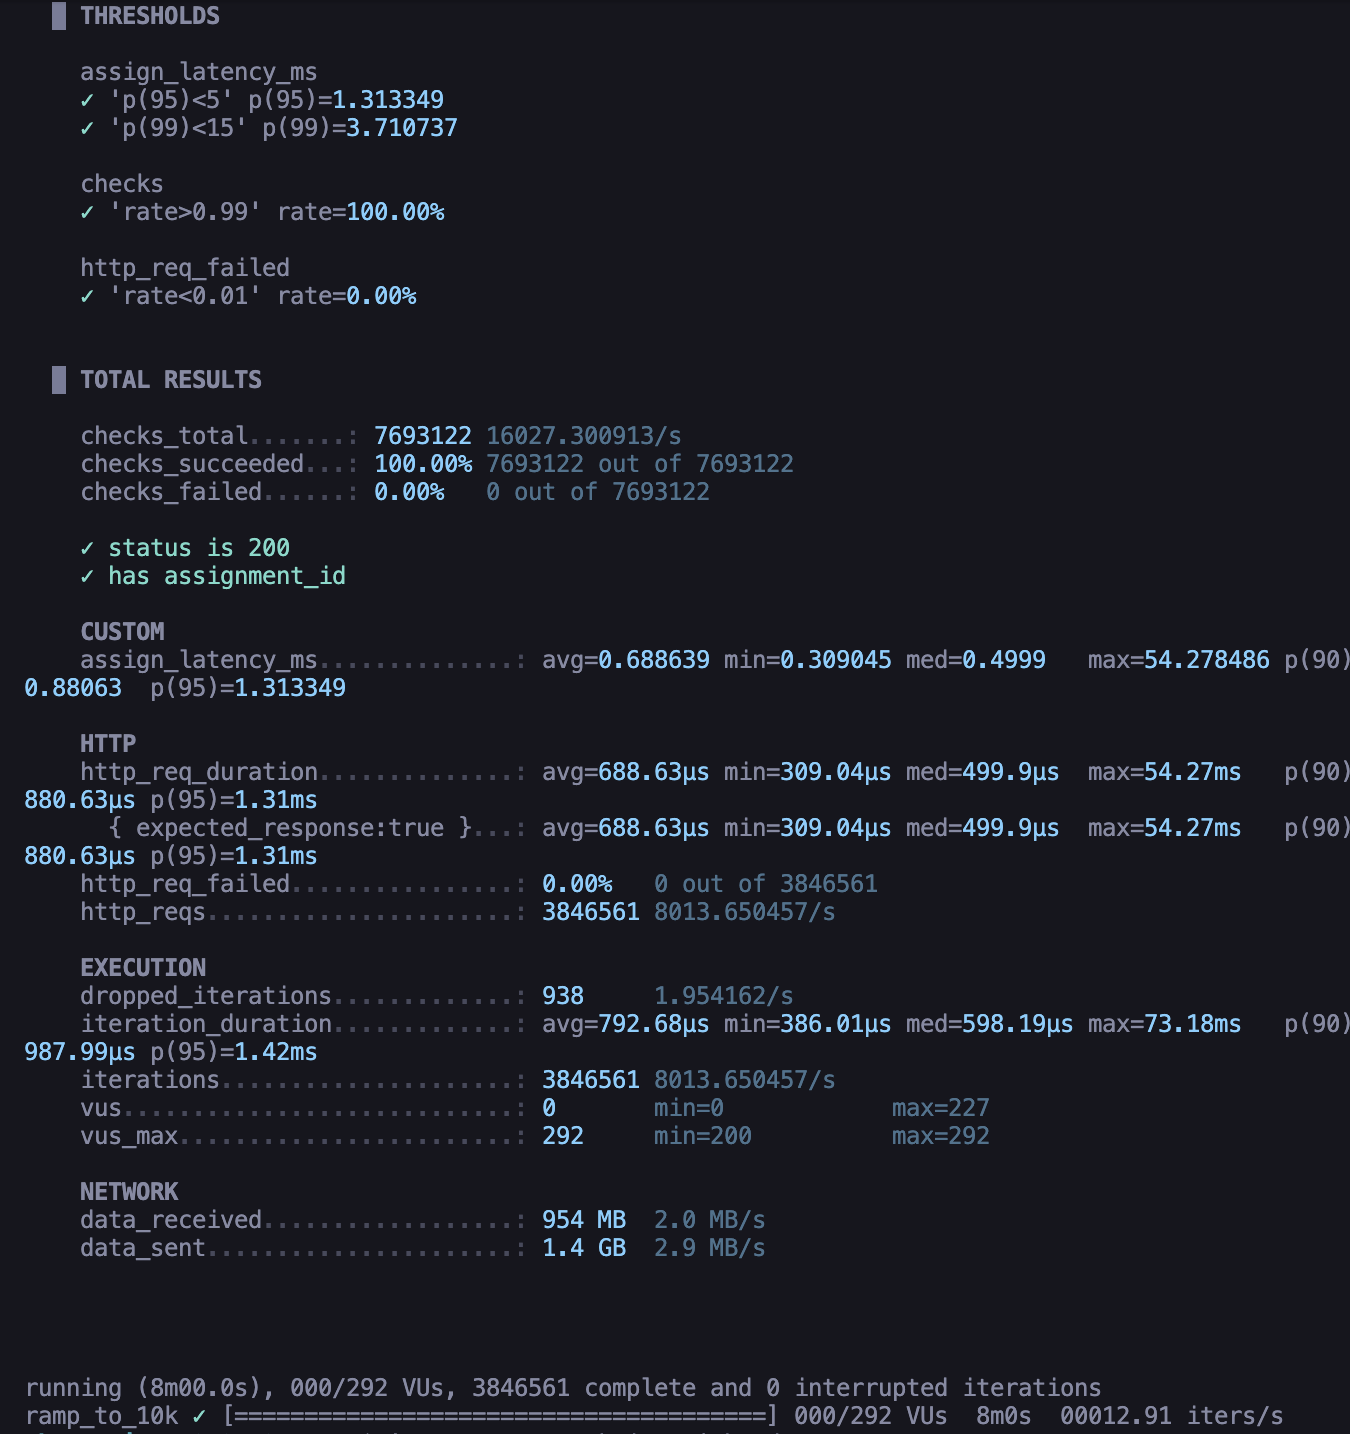
The k6 summary from the run — assignment latency, check rate, and failure rate, straight off the terminal. No post-processing.
We don't say fast — we show you the run. Every performance number on this stack is measured, not marketed. Here's the k6 load test that produced this one, with the full method and the raw output.
* Measured under a realistic mix of new and returning users — an estimated ~25% first-time assignments (full compute) and ~75% cache-served, from a 1M-ID pool drawn across 3.8M requests. Both thresholds (p95<5ms, p99<15ms) passed with margin.
The k6 summary from the run — assignment latency, check rate, and failure rate, straight off the terminal. No post-processing.
The k6 dashboard in real time. Request rate ramps to 10,000/s and stays there; the latency line stays flat along the floor the entire time.
Not one cherry-picked number — the full percentile distribution, measured end-to-end and server-side.
| Metric | p50 | p90 | p95 | p99 | avg |
|---|---|---|---|---|---|
| Assignment latency end-to-end | 0.50 | 0.88 | 1.31 | 3.71 | 0.69 |
| Server processing excl. network | 0.47 | 0.82 | 1.22 | — | 0.65 |
This run reflects a realistic mix of new and returning users — an estimated ~25% first-time assignments (the full segment-match, bucketing, and exposure-write path) and ~75% cache-served, the split you'd expect from steady-state production traffic.
Both thresholds — p95 under 5ms and p99 under 15ms — passed with wide margin. Returning users are served from cache at near-zero latency, so as the returning share of your traffic grows, the numbers only get better.
The setup matters more than the number. Here's exactly what produced it.
| Endpoint under load | POST /v1/experiments/assign — the full experiment-assignment path: segment match, deterministic bucketing, and exposure write, all on the request. |
| Assignment path | A realistic mix of new and returning users — entity IDs drawn from a 1,000,000 pool across 3.8M requests, yielding an estimated ~25% first-time (full-compute) and ~75% cache-served. |
| Server | Single AWS c6i.xlarge (4 vCPU) running the API, worker, Postgres, and a two-instance Redis topology under Docker Compose. |
| Load generator | Separate c6i instance running k6, ramping arrival rate 500 → 10,000 req/s over the private network. |
| Volume | 3,846,561 assignments served in the measured window; 7.69M checks, all passed. |
| Evaluation model | In-process, in-memory config cache — assignment resolves with zero network calls off the request path. |
One honest note on the number: 10K is the sustained plateau, measured across the five-minute hold. The whole-window average is lower (~8K/s) because it folds in the ramp-up and cool-down — arithmetic, not a ceiling. At 1.3 ms p95 on a single 4-vCPU box, the server had headroom to spare; the number scales with the hardware behind it.